How to Inspect a Thread Dump Like a Pro
Luke Hebert
- 9 minutes read - 1750 wordsWhen a Java application starts misbehaving, a thread dump is your fastest window into what is actually happening inside the JVM. This guide walks through capturing dumps with jstack, jcmd, and signal-based methods, then shows you how to read thread states, spot CPU hogs, detect deadlocks, and use dedicated analysis tools to cut through hundreds of threads quickly.
Capturing a Thread Dump
There are several ways to grab a thread dump. On Linux or Unix machines, you can send the SIGQUIT signal to the JVM process:
kill -3 <PID>By default, the output goes to the server console. To redirect it to a file, add these JVM startup options:
-XX:+UnlockDiagnosticVMOptions -XX:+LogVMOutput -XX:LogFile=jvm.logTwo JDK tools make this easier and let you redirect output without extra startup flags. The first is jstack, which takes the Java process PID as an argument:
jstack -l <PID> jstack.outThe second is jcmd, also part of your default JDK toolkit:
jcmd <PID> Thread.printOn Windows, if the JVM was started from a command prompt or console, you can trigger a thread dump by pressing Ctrl+Break in the console window where the JVM is running.
Inside the Thread Dump
Before digging into a dump, here is a quick recap of Java thread states:
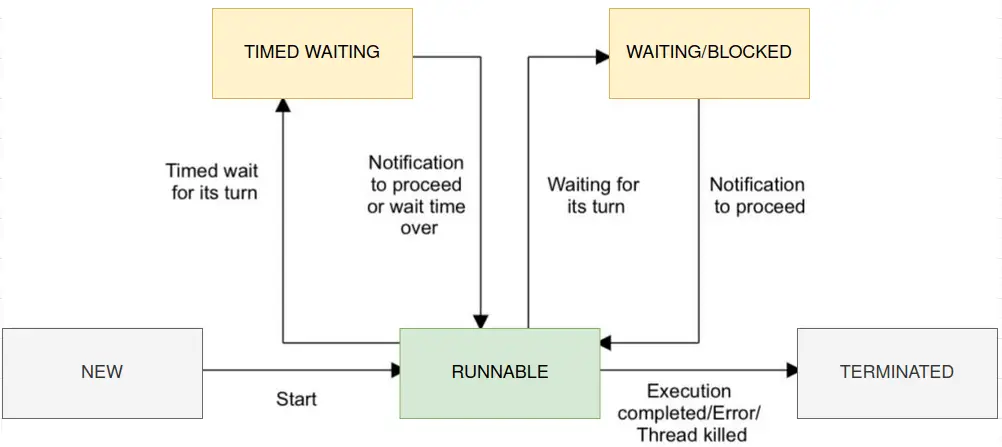
Once a thread starts, it can enter one of the following states:
- Runnable: The thread is either actively running or ready to run. The thread scheduler decides when it gets CPU time.
- Timed Waiting: The thread is in a conditional wait, such as a
sleepcall or an operation with a timeout. - Blocked/Waiting: The thread is temporarily inactive:
- Blocked: Waiting for another thread to release a lock. Cannot be interrupted.
- Waiting: Waiting for a notification from other threads. Can be interrupted.
Here is a real thread dump example from an application server with an embedded JMS server:
"Thread-5 (org.apache.activemq.artemis.core.remoting.impl.invm.InVMConnector)" #272 prio=5 os_prio=0 cpu=0.83ms elapsed=7.12s tid=0x0000000007d97800 nid=0x1015 waiting on condition [0x00007f1913559000]
   java.lang.Thread.State: TIMED_WAITING (parking)
	at jdk.internal.misc.Unsafe.park(java.base@11/Native Method)
	- parking to wait for <0x00000000e318fb48> (a java.util.concurrent.locks.AbstractQueuedSynchronizer$ConditionObject)
	at java.util.concurrent.locks.LockSupport.parkNanos(java.base@11/LockSupport.java:234)
	at java.util.concurrent.locks.AbstractQueuedSynchronizer$ConditionObject.awaitNanos(java.base@11/AbstractQueuedSynchronizer.java:2123)
	at java.util.concurrent.LinkedBlockingQueue.poll(java.base@11/LinkedBlockingQueue.java:458)
	at org.apache.activemq.artemis.utils.ActiveMQThreadPoolExecutor$ThreadPoolQueue.poll(ActiveMQThreadPoolExecutor.java:112)
	at org.apache.activemq.artemis.utils.ActiveMQThreadPoolExecutor$ThreadPoolQueue.poll(ActiveMQThreadPoolExecutor.java:45)
	at java.util.concurrent.ThreadPoolExecutor.getTask(java.base@11/ThreadPoolExecutor.java:1053)
	at java.util.concurrent.ThreadPoolExecutor.runWorker(java.base@11/ThreadPoolExecutor.java:1114)
	at java.util.concurrent.ThreadPoolExecutor$Worker.run(java.base@11/ThreadPoolExecutor.java:628)
	at org.apache.activemq.artemis.utils.ActiveMQThreadFactory$1.run(ActiveMQThreadFactory.java:118)
	Locked ownable synchronizers:
	- None
Focus on the last application-level class in the stack trace: ActiveMQThreadPoolExecutor. You can check the source code on GitHub:
@Override
public Runnable poll(long arg0, TimeUnit arg2) throws InterruptedException {
    // Increment the delta as a thread becomes idle
    // by waiting for a task to poll from the queue
    DELTA_UPDATER.incrementAndGet(this);
    Runnable runnable = null;
    try {
        runnable = super.poll(arg0, arg2);
    } finally {
        // Now the thread is no longer idle waiting for a task
        // If it had taken a task, the delta remains the same
        // (decremented by the thread and incremented by the taken task)
        if (runnable == null) {
            DELTA_UPDATER.decrementAndGet(this);
        }
    }
    return runnable;
}
In plain terms, this code is polling for data and tracking how long the thread has been idle.
Individual threads sitting in a TIMED_WAITING state do not consume CPU. The next section shows what a CPU-consuming thread looks like.
Threads and CPU Usage
CPU load is proportional to the number of active processes in running or uninterruptible states (such as I/O locks or kernel locks) per unit time. Here is an example:
"App-Thread1" #1 prio=5 os_prio=0 cpu=22484.99ms elapsed=77.44s tid=0x00007fcbfc00f800 nid=0x16a4 runnable [0x00007fcc01437000]
   java.lang.Thread.State: RUNNABLE
	at java.io.FileOutputStream.writeBytes(java.base@11/Native Method)
	at java.io.FileOutputStream.write(java.base@11/FileOutputStream.java:354)
	at java.io.BufferedOutputStream.flushBuffer(java.base@11/BufferedOutputStream.java:81)
	at java.io.BufferedOutputStream.flush(java.base@11/BufferedOutputStream.java:142)
	- locked <0x0000000430062c00> (a java.io.BufferedOutputStream)
	at java.io.PrintStream.write(java.base@11/PrintStream.java:561)
	- locked <0x0000000430062bd8> (a java.io.PrintStream)
	at sun.nio.cs.StreamEncoder.writeBytes(java.base@11/StreamEncoder.java:233)
	at sun.nio.cs.StreamEncoder.implFlushBuffer(java.base@11/StreamEncoder.java:312)
	at sun.nio.cs.StreamEncoder.flushBuffer(java.base@11/StreamEncoder.java:104)
	- locked <0x000000043007a7d0> (a java.io.OutputStreamWriter)
	at java.io.OutputStreamWriter.flushBuffer(java.base@11/OutputStreamWriter.java:184)
	at java.io.PrintStream.write(java.base@11/PrintStream.java:606)
	- eliminated <0x0000000430062bd8> (a java.io.PrintStream)
	at java.io.PrintStream.print(java.base@11/PrintStream.java:745)
	at java.io.PrintStream.println(java.base@11/PrintStream.java:882)
	- locked <0x0000000430062bd8> (a java.io.PrintStream)
	at acme.com.Connector.connect(Connector.java:104)
	at acme.com.Connector.init(Connector.java:54)
This tells a different story. The thread “App-Thread1” is in RUNNABLE state and is overusing the CPU (cpu=22484.99ms) by writing streams of data. The connect method in the acme.com.Connector class is actively writing and flushing to the filesystem.
Rule of Thumb #1: Check for application packages in the thread dump.
Look for your own application classes. Check the thread status and CPU consumption of those threads. If there are no evident flaws in your code, follow the call flow to see where it lands. If the stack points to a Java library, check for known issues with that class. If it points to Java internals or native execution, check your JVM or OS settings.
Rule of Thumb #2: Use Java 11+ to display CPU usage of each thread.
JDK 11 and later include per-thread CPU usage directly in the dump. On older versions, use top to find the Java thread IDs consuming the most CPU, then convert the PID to hex:
$ printf 0x%x 10640
0x2c4c
Then search your thread dump for the thread with nid=0x2c4c.
Threads and Poor Performance
Now consider a scenario where CPU and memory look fine, but the application is hanging or performing badly. Here is a stack trace from a real issue with Apache HttpClient connection pooling:
"ajp-j2ee.instance.jirastudio.com-jira%2F127.0.0.104-8009-1" daemon prio=10 tid=0x0ab53400 nid=0x3805 in Object.wait() [0x714c0000]
   java.lang.Thread.State: WAITING (on object monitor)
	at java.lang.Object.wait(Native Method)
	at org.apache.commons.httpclient.MultiThreadedHttpConnectionManager.doGetConnection(MultiThreadedHttpConnectionManager.java:509)
	- locked <0x8d0e0df8> (a org.apache.commons.httpclient.MultiThreadedHttpConnectionManager$ConnectionPool)
	at org.apache.commons.httpclient.MultiThreadedHttpConnectionManager.getConnectionWithTimeout(MultiThreadedHttpConnectionManager.java:394)
	at org.apache.commons.httpclient.HttpMethodDirector.executeMethod(HttpMethodDirector.java:152)
	at org.apache.commons.httpclient.HttpClient.executeMethod(HttpClient.java:396)
	at org.apache.commons.httpclient.HttpClient.executeMethod(HttpClient.java:324)
	at com.atlassian.crowd.integration.rest.service.RestExecutor$MethodExecutor.executeCrowdServiceMethod(RestExecutor.java:443)
	at com.atlassian.crowd.integration.rest.service.RestExecutor$MethodExecutor.andCheckResponse(RestExecutor.java:369)
	at com.atlassian.crowd.integration.rest.service.RestCrowdClient.invalidateSSOToken(RestCrowdClient.java:854)
	at com.atlassian.crowd.integration.http.CrowdHttpAuthenticatorImpl.logout(CrowdHttpAuthenticatorImpl.java:175)
	at com.atlassian.crowd.integration.http.CacheAwareCrowdHttpAuthenticator.logout(CacheAwareCrowdHttpAuthenticator.java:78)
	at com.atlassian.crowd.integration.seraph.v22.CrowdAuthenticator.logout(CrowdAuthenticator.java:145)
	at com.atlassian.crowd.integration.seraph.v22.CrowdAuthenticator.login(CrowdAuthenticator.java:110)
	at com.atlassian.seraph.filter.PasswordBasedLoginFilter.runAuthentication(PasswordBasedLoginFilter.java:127)
	at com.atlassian.seraph.filter.PasswordBasedLoginFilter.login(PasswordBasedLoginFilter.java:72)
This is a classic connection pool exhaustion. Every resource in a system (database connections, thread executors, HTTP connections) is generally maintained in a pool. Once the number of requests exceeds what is available, threads pile up in WAITING or BLOCKED state.
Rule of Thumb #3: Check constraints for WAITING/BLOCKED threads.
Look for threads in WAITING or BLOCKED state and identify which configuration setting is causing it. Check all max-threads and max-connections limits. The bottleneck might also be on external systems, such as a database SGA limit or cursor count.
Rule of Thumb #4: Identify which thread is holding the lock.
If two threads are waiting on each other’s lock, you have a deadlock:
"Thread-0":
  waiting to lock monitor 0x000000002334a280 (object 0x00000000c7a49f40,
  a java.lang.Object),
  which is held by "Thread-1"

"Thread-1":
  waiting to lock monitor 0x000000002334a480 (object 0x00000000c7a49f30,
  a java.lang.Object),
  which is held by "Thread-0"
The default deadlock detection works with locks obtained via the synchronized keyword and the java.util.concurrent package. If the JVM flag -XX:+PrintConcurrentLocks is set, the stack trace also shows a list of lock owners.
Tools You Can Use to Analyze Thread Dumps
An application can run hundreds of threads. You need a tool that groups them by category and highlights the most common stack traces. Here is a selection.
Rule of Thumb #5: Pay attention to threads with the same stack trace.
Whatever tool you use, start by finding threads with an identical stack trace. Check whether the application logic actually requires that many threads in that state. Compare dumps taken at different times to see if certain thread groups are growing.
Tool 1: FastThread.io
FastThread is one of the best online tools for analyzing thread dumps. You can reach it at https://fastthread.io/. The free plan allows 5 uploads per month. After uploading a dump, an Intelligence Report is generated:
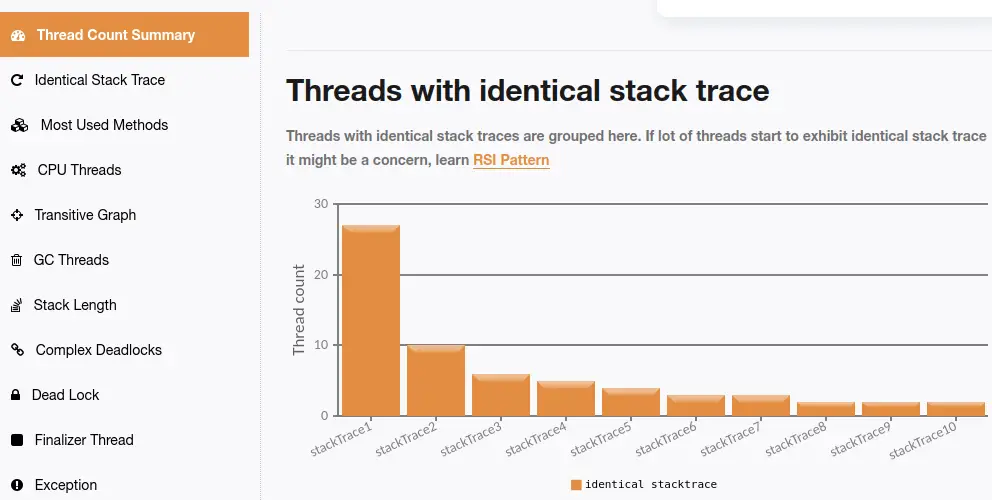
Key sections to focus on:
- Threads with identical stack trace: Groups threads sharing the same trace. This is a strong indicator of resource contention on external resources such as an RDBMS or thread pool.
- Most used methods: If you take multiple dumps in sequence, you can see which methods are called most frequently.
- CPU consuming threads: FastThread flags threads likely responsible for high CPU usage.
- Blocking threads: Lists threads that could make your application unresponsive. Deadlocks are reported here.
- Exceptions: Dumps containing exceptions in the stack trace are grouped for further investigation.
Tool 2: JStack Review
JStack is a free tool available at https://jstack.review/. Once you upload a dump, you can:
- Group threads by status
- Find threads with identical stack traces
- Compare multiple thread dumps side by side
Tool 3: Thread Dump Analyzer (TDA)
The TDA Thread Dump Analyzer for Java is a compact Swing GUI for analyzing sets of thread dumps. It provides statistical insights, details on locked monitors and waiting threads, thread comparisons, and long-running thread detection.
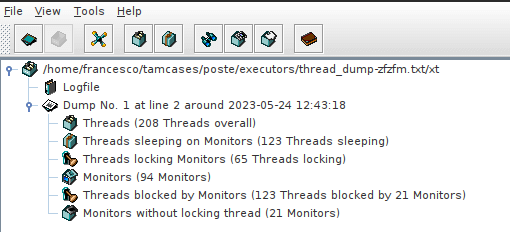
A simple way to run TDA is through its jBang alias. With jBang installed, just run:
jbang tda@maxandersen/tdaYATDA
YATDA (Yet Another Thread Dump Analyzer) is a shell script that helps detect common concerns in JBoss or Tomcat web servers. Download it from https://github.com/aogburn/yatda.
YATDA collects and sorts the tops of thread stacks to show what threads are most commonly doing. It provides specific stats for JBoss request threads and boot threads, and can be pointed at custom thread names. Run it by passing the dump file as an argument:
./yatda.sh -f mydump.txtThe generated report includes:
- Specific findings, such as whether the current request thread count fits the default thread pool size
- Top lines of request threads
- Most common lines from the first 20 lines of request threads
- Top lines of all threads
- Most common lines from the first 10 lines of all threads
A single thread dump is rarely enough. In most cases, you need to capture multiple dumps over time to confirm your hypothesis.
Capturing Dumps at Regular Intervals
A common best practice is to collect a set of dumps at regular intervals, for example every 10 seconds. Here is a basic shell script:
#!/bin/sh
# Generate N thread dumps of the process PID with an INTERVAL between each dump.
if [ $# -ne 3 ]; then
    echo "Generates Java thread dumps using the jstack command."
    echo
    echo "usage: $0 process_id repetitions interval"
    exit 1
fi

PID=$1
N=$2
INTERVAL=$3

for ((i=1; i<=$N; i++))
do
    d=$(date +%Y%m%d-%H%M%S)
    dump="./threaddump/threaddump-$PID-$d.txt"
    echo "$i of $N: $dump"
    jstack -l $PID > $dump
    sleep $INTERVAL
done
To take 10 thread dumps with a 10-second interval:
./threaddump-script.sh <pid> 10 10Capturing a Thread Dump of a Java Application in a Container
Finally, here is how to capture a thread dump from a Java application running in a Docker container.
First, get the container ID:
$ docker ps
CONTAINER ID   IMAGE
948303c4e2ab   quay.io/wildfly/wildfly-centos7
Next, store the PID of the Java process in a variable:
PID=$(docker exec 948303c4e2ab jps | grep -v Jps | awk '{print $1}')The jps utility is available in the Java bin folder inside the container. The rest is straightforward:
docker exec 948303c4e2ab jstack -l $PIDThe output is printed to your host console. From there, you can pipe it to a file or feed it directly into one of the analysis tools above.