Finding Which Java Threads Are Eating Your CPU for Breakfast
Luke Hebert
- 4 minutes read - 805 wordsA Java process pegging your CPU is frustrating until you can name the exact thread doing the work. The JDK ships with several tools that make this straightforward, whether you prefer a GUI, a quick shell one-liner, or a programmatic approach. Below are five practical methods to isolate the offending thread.
Use JVisualVM to Find CPU-Consuming Threads
If you have JVisualVM installed, connect to the remote machine and open the Thread CPU Time sub-panel. It shows how much CPU time each thread has spent since sampling started (Thread CPU Time [ms]) and the instantaneous rate (Thread CPU Time [ms/sec]) on the far right.
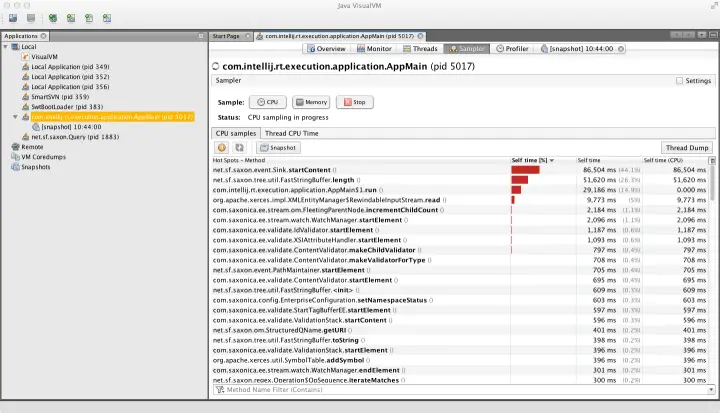
The advantage here is real-time visibility into which method is consuming the most CPU, and you can monitor memory usage with the same tool. On the downside, JVisualVM itself can be memory- and CPU-hungry, and its agent may add overhead to the very process you are trying to diagnose.
Use the jstack Command to Find CPU-Consuming Threads
If all you have is a terminal, jstack is your friend. With the -l flag it prints a thread dump that includes per-thread CPU time in milliseconds.
First, find the PID of your Java process:
$ jps -v | grep -v Jps
5213 jboss-modules.jar -D[Standalone] -Xms64m -Xmx512m -XX:MetaspaceSize=96M -XX:MaxMetaspaceSize=256m -Djava.net.preferIPv4Stack=true
Next, capture a thread dump and filter for CPU usage:
$ jstack -l 5213 | grep cpu
"Reference Handler" #2 daemon prio=10 os_prio=0 cpu=2.76ms elapsed=7027.22s tid=0x00000000013bb800 nid=0x1465 waiting on condition [0x00007f386cc0c000]
"Finalizer" #3 daemon prio=8 os_prio=0 cpu=1.30ms elapsed=7027.22s tid=0x00000000013c6000 nid=0x1466 in Object.wait() [0x00007f386cb0b000]
"Signal Dispatcher" #4 daemon prio=9 os_prio=0 cpu=0.31ms elapsed=7027.21s tid=0x00000000013db000 nid=0x1467 runnable [0x0000000000000000]
"C2 CompilerThread0" #5 daemon prio=9 os_prio=0 cpu=6033.64ms elapsed=7027.21s tid=0x00000000013dd800 nid=0x1468 waiting on condition [0x0000000000000000]
"C1 CompilerThread0" #8 daemon prio=9 os_prio=0 cpu=2371.86ms elapsed=7027.21s tid=0x00000000013e0000 nid=0x1469 waiting on condition [0x0000000000000000]
...
Along with the thread name you get the cumulative CPU time in milliseconds. To sort threads by CPU usage, pipe through awk and sort:
$ jstack -l 5213 | grep cpu | awk 'match($0, /cpu=[[:digit:].]+/){print substr($0, RSTART+4, RLENGTH-1)+0, $0}' | sort -n -k1,1 | cut -d' ' -f2-Use the top Command to Find CPU-Consuming Threads
You can also use top to see per-thread CPU usage for a Java process.
Detect the PID first:
$ jps -v
11218 Jps -Dapplication.home=/usr/lib/jvm/java-1.8.0-openjdk-1.8.0.191.b13-0.fc29.x86_64 -Xms8m
10824 jboss-modules.jar -D[Standalone] -Xms64m -Xmx512m -XX:MetaspaceSize=96M -XX:MaxMetaspaceSize=256m -Djava.net.preferIPv4Stack=true -Djboss.modules.system.pkgs=org.jboss.byteman -Djava.awt.headless=true -Dorg.jboss.boot.log.file=/home/francesco/jboss/wildfly-19.0.0.Final/standalone/log/server.log -Dlogging.configuration=file:/home/francesco/jboss/wildfly-19.0.0.Final/standalone/configuration/logging.properties
Then run top in thread mode against that PID:
$ top -n 1 -H -p 11218The -H flag toggles thread display. Without it, top shows a single aggregated row for the whole process.
On Solaris, the equivalent is:
$ prstat -L -p 11218The catch: Java thread dumps use a hex thread ID (nid), while top and prstat report decimal PIDs. Convert with printf:
$ printf '0x%x\n' 10841
0x2a59
That hex value matches the nid field in a jstack dump. So to find the offending thread:
$ jstack -l 11218 | grep "0x2a59"
"default I/O-7" #95 prio=5 os_prio=0 tid=0x00007fe714151000 nid=0x2c4c runnable [0x00007fe6d79f8000]
In this example the thread is doing I/O work. Inspecting its full stack trace will point you toward the root cause.
Programmatically Find Which Thread Is Consuming CPU
If you prefer a code-level approach, the java.lang.management.ThreadMXBean class (part of the JMX management API) exposes per-thread CPU time. Once you obtain the bean from ManagementFactory:
ThreadMXBean tmxb = ManagementFactory.getThreadMXBean();

// Query how much CPU a specific thread has consumed
long cpuTime = tmxb.getThreadCpuTime(aThreadID);
This is handy when you want to build alerts or dashboards around thread-level CPU usage.
Use jvmtop to Find Which Thread Is Consuming CPU
jvmtop is a lightweight, top-like console tool that monitors all accessible JVMs on a machine. It displays memory, GC, and per-thread CPU metrics, and includes a built-in CPU profiler.
Example output:
JvmTop 0.4.1 alpha amd64, 4 cpus, Linux 2.6.18-34

PID 3539: org.apache.catalina.startup.Bootstrap
ARGS: start
VMARGS: -Djava.util.logging.config.file=/home/webserver/apache-tomcat-5.5[...]
VM: Sun Microsystems Inc. Java HotSpot(TM) 64-Bit Server VM 1.6.0_25
UP: 869:33m  #THR: 106  #THRPEAK: 143  #THRCREATED: 128020  USER: webserver
CPU: 4.55%  GC: 3.25%  HEAP: 137m / 227m  NONHEAP: 75m / 304m
Note: Only top 10 threads (according cpu load) are shown!

TID      NAME                              STATE          CPU     TOTALCPU  BLOCKEDBY
25       http-8080-Processor13             RUNNABLE       4.55%   1.60%
128022   RMI TCP Connection(18)-10.101.    RUNNABLE       1.82%   0.02%
36578    http-8080-Processor164            RUNNABLE       0.91%   2.35%
36453    http-8080-Processor94             RUNNABLE       0.91%   1.52%
27       http-8080-Processor15             RUNNABLE       0.91%   1.81%
14       http-8080-Processor2              RUNNABLE       0.91%   3.17%
128026   JMX server connection timeout     TIMED_WAITING  0.00%   0.00%
128025   JMX server connection timeout     TIMED_WAITING  0.00%   0.00%
128024   JMX server connection timeout     TIMED_WAITING  0.00%   0.00%
128023   JMX server connection timeout     TIMED_WAITING  0.00%   0.00%
Summary
Between JVisualVM, jstack, top/prstat, ThreadMXBean, and jvmtop, you have plenty of options to identify exactly which Java thread is consuming your CPU on a Linux or Unix system. Pick the tool that fits your environment, and you should be able to isolate the offending thread in under a minute.